

.png.c9b8f3e9eda461da3c0e9ca5ff8c6888.png)
Fiddler is one of the most powerful and best-used web debugging tools, which can record http and https requests from all clients and servers. Allows you to monitor, set breakpoints, and even modify input and output data. Fiddler includes a powerful event script-based subsystem and can be extended using the .net language. In other words, the more you understand the HTTP protocol, the more you can master the use of Fiddler. The more you use Fiddler, the more it will help you understand the HTTP protocol. Fiddler is a very useful tool for developers or testers.
Download and Install
Let’s go directly to the official website to download. Official website address: https://www.telerik.com/fiddler

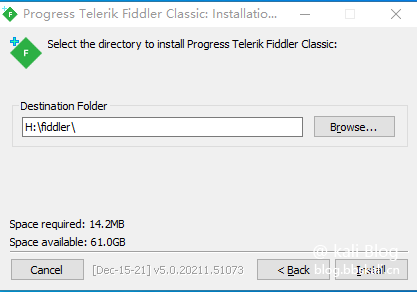
The file is relatively small, about 6M. Install it directly after the download is completed.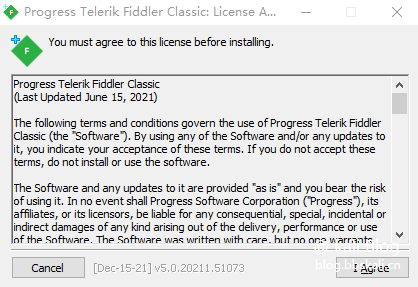
After the installation is completed, the effect is as follows 
Panel Introduction
Left Panel
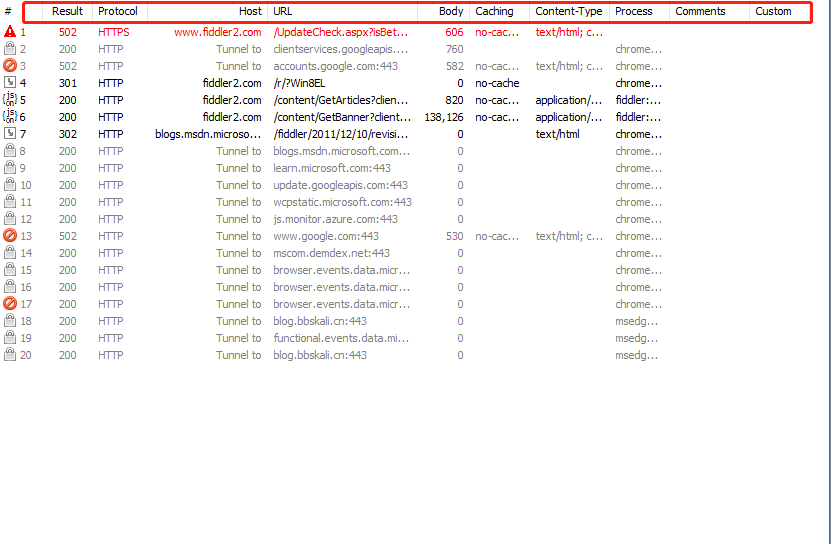
: The order of HTTP Requests starts from 1, incrementing in the order of page loading requests.
Result : The status of HTTP response
Protocol: The protocol used by the request (such as HTTP/HTTPS)
HOST: domain name/ip of the request address
URL: The requested server path and file name, also contains GET parameters
BODY: The size of the request, in units of byte
Content-Type: The type of request response
Caching: The requested cache expiration time or the cache control header value
Process: The Windows process and process ID that issued this request
Comments: User adds notes to this session through scripts or menus
custom: Custom values that users can set through scripts
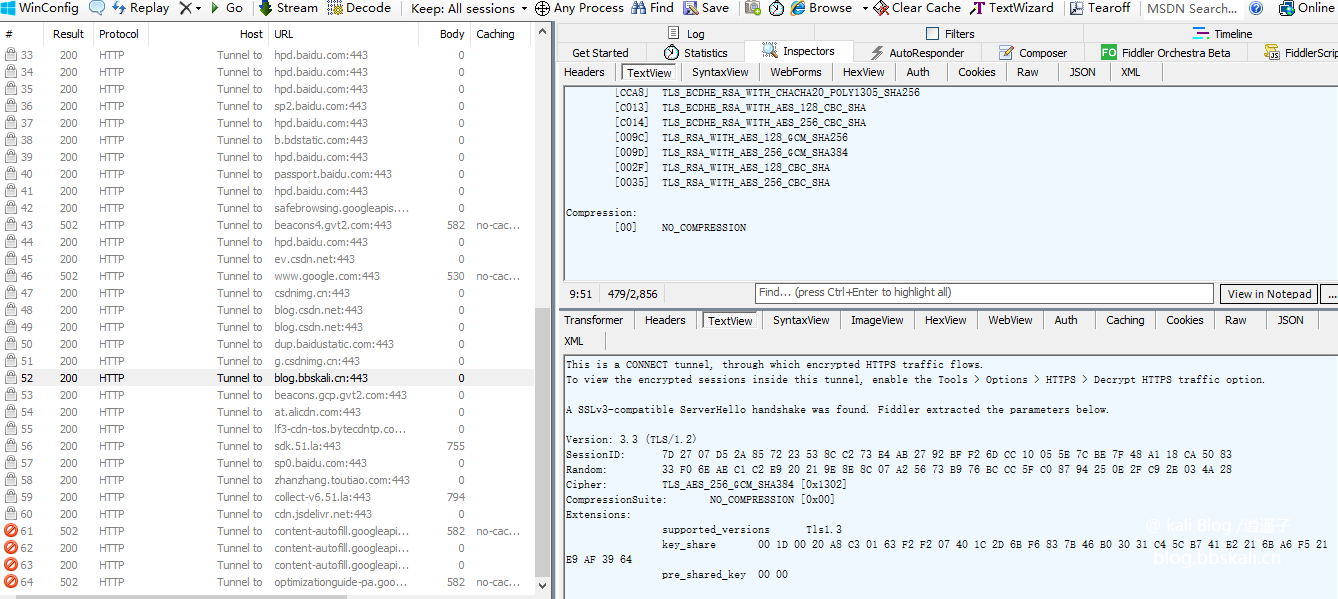
Right Panel
Statistics Statistics
Through this tab, the user can obtain the total information statistics of these sessions by selecting multiple sessions, such as the number of bytes requested and transmitted. Select the first request and the last request to get the overall time spent on the entire page loading. From the bar chart, you can also distinguish which requests take the most time, so as to optimize the access speed of the page
Inspectors check page tab
It provides headers, textview, hexview, Raw and other methods to view the information of a single http request message. It is divided into two parts: the upper part is the HTTP Request display, and the lower part is the HTTPResponse display (response) display.
AutoResponse Automatic Response Tab
Fiddler's most practical function is that it can crawl online pages and save them locally for debugging, greatly reducing the difficulty of online debugging. It allows us to modify the data returned by the server, such as making the return all HTTP404 or reading local files as the return content.
composer build tab
Supports manual construction and sending HTTP, HTTPS and FTP requests. We can also drag the session from the web session list and put it in the composer tab. When we click the Execute button, we send the request to the server.
log log tab: Print log
Filters Filters Tab
The filter can filter the data stream list on the left, and we can mark, modify, or hide data streams of certain characteristics.
Catch HTTPS package
By default, you can only capture http packets. If you want to capture https packets, we need simple settings.
Click tool-options-https to check the following 
Then click Actions-Export Root Certificate to Desktop, and this file will appear on the desktop
Next we need to import the certificate on the browser, taking Google Chrome as an example: Click Settings - Security and Privacy Settings - Security - Management Certificate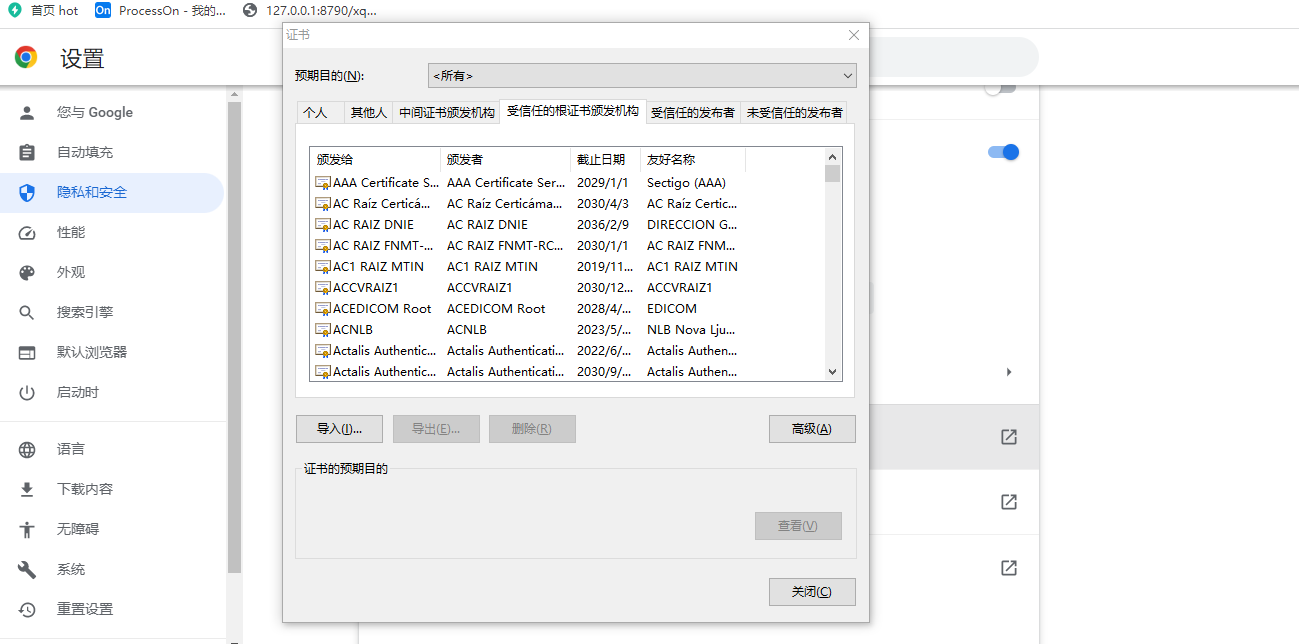
Now we can catch the https package.