


By HireHackking in HACKER
· 1 view
Wireshark is the world's top and widely used network protocol analysis tool. It allows you to see what’s happening on the web at a micro level and is a research standard for many commercial and nonprofit corporate educational institutions. Supports hundreds of protocols and continues to add more protocols. It has real-time capture and offline analysis, multi-platform, supports graphical interface and command line and other functions. This allows us to analyze data quickly and intuitively.
Start
The startup of Wireshark is very simple. We can find the Wireshark icon in the start menu, or execute the Wireshark command in the terminal.
Entering the homepage of the wireshark tool will allow us to select the network card to monitor. Select our listening network card. Just double-click.
Interface introduction
Wireshark can be roughly divided into five areas, which are shown below.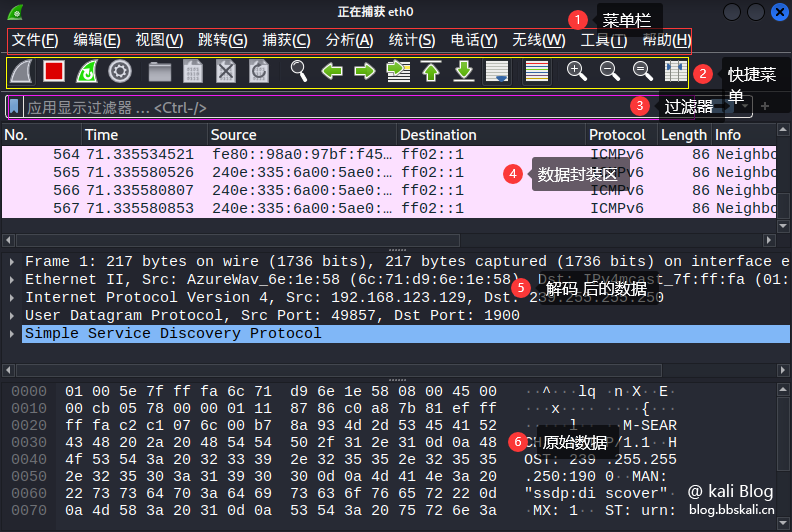
The shortcut function bar corresponds to
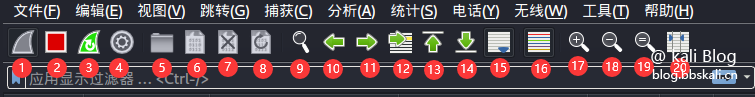
Serial number description function 1 Start packet capture start tool Start packet capture 2 Stop packet capture tool Packet capture 3 Restart packet capture restart 4 Packet capture settings Used to set packet capture parameters 5 Open packet file Open offline or saved packet 6 Save packet save data 7 Close Capture file Close Current 8 Reload Reload 9 Find Search Data (most commonly used) 10 Go to the previous packet packet data jump 11 Go to the next packet packet data jump 12 Go to the specific packet packet data jump 13 Go to the first packet packet data jump 14 Go to the real-time packet packet data jump 15 Follow the latest packet packet data jump 16 Color different protocols to facilitate the distinction protocol 17 Zoom in main window text enlarge text 18 Shrink main window text reduction text 19 Reset main window text reset window 20 Adjust group list adaptation content as above
Data List Bar
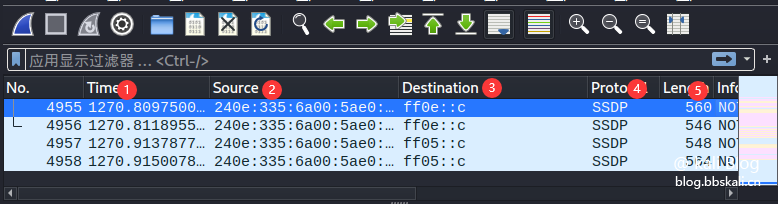
Serial number description function 1 Time indicates the time of the capture packet 2 Source indicates the source address 3 Destination indicates the destination address 4 Protocol indicates the protocol name 5Length indicates the length of the packet 6 Info indicates the information of the packet
The slight test
01 Filter IP
Only look at the packet with the destination IP address:
ip.dst==xxx.xxx.xxx.xxx.xxx If we only see data reaching 192.168.123.1 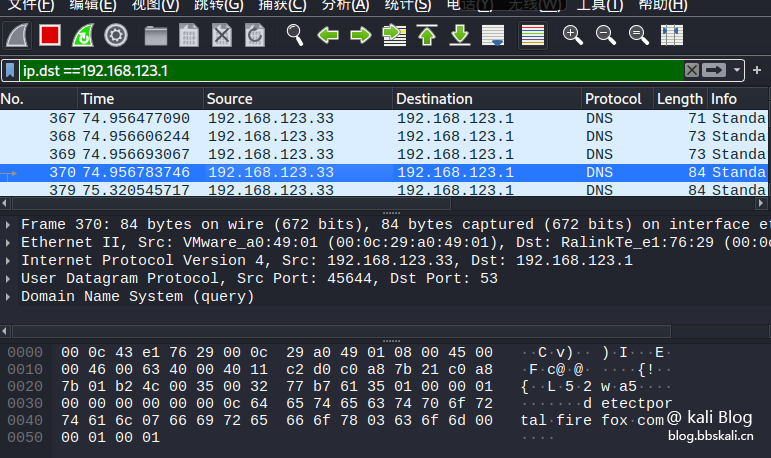
Only look at the packets from the source IP address:
ip.src==xxx.xxx.xxx.xxx.xxx If we only look at the data from 192.168.123.33 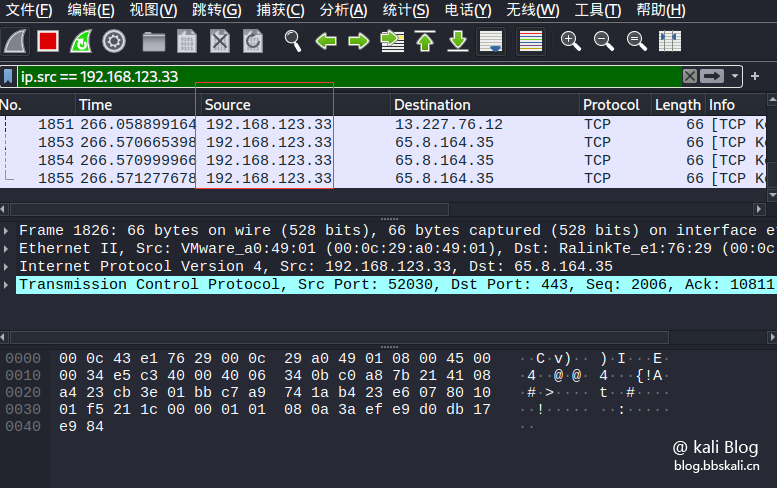
View packets for an IP address:
ip.addr eq xxx.xxx.xxx.xxxx.xxxx
#like
ip.addr eq 192.168.123.33 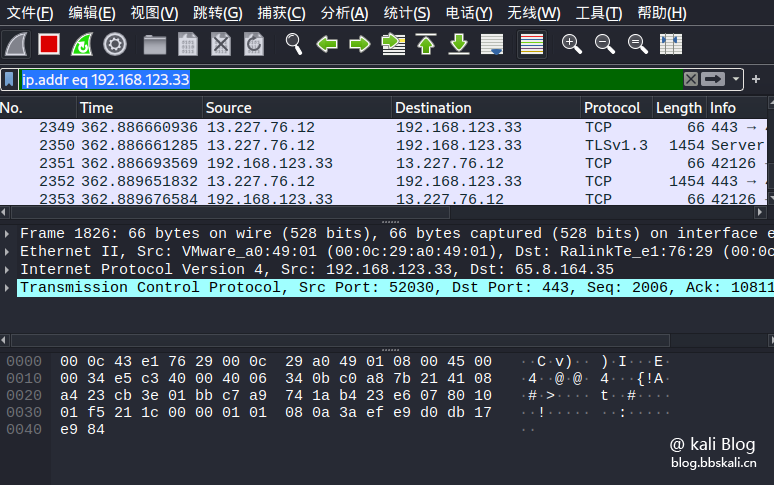
Filter port
Only display packets with the source address or destination address of tcp protocol port 80:
ip.addr eq xxx.xxx.xxx.xxx tcp.port==80 port 80 packets with source address tcp protocol:
tcp.srcport==80 port 80 packets whose destination address is TCP protocol:
tcp.dstport==80 only display packets with port number greater than or equal to 0 and less than or equal to 100: (no distinction between source and destination IP)
tcp.srcport=0 tcp.srcport=100 filter protocol
tcp/udp/ip/dhcp/icmp/ftp/dns/http/arp/.etc.
If we only look at the tcp protocol 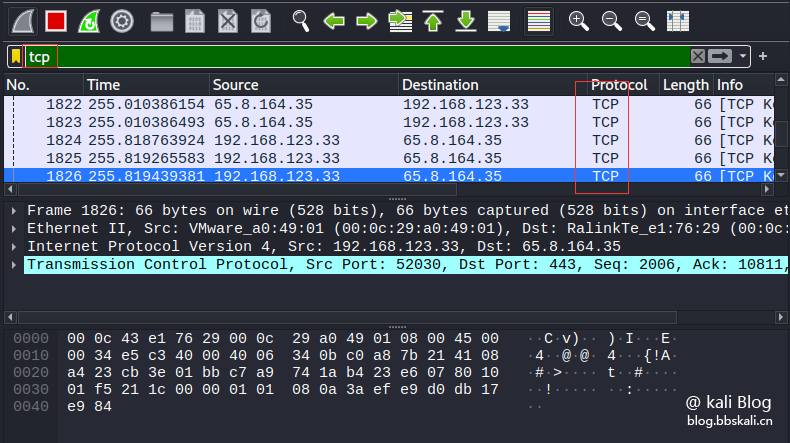
Other agreements are the same as above.
Filter MAC address
Only display data packets with source MAC address xx:xx:xx:xx:xx:xx:xx:xx
eth.src==xx:xx:xx:xx:xx:xx:xx:xx only displays data packets with destination address xx:xx:xx:xx:xx:xx
eth.dst==xx:xx:xx:xx:xx:xx:xx:xx:10-1010 Only data packets with UDP protocol and length greater than or equal to 10
Here=means greater than or equal to=means less than or equal to==means equal to
udp.length=10 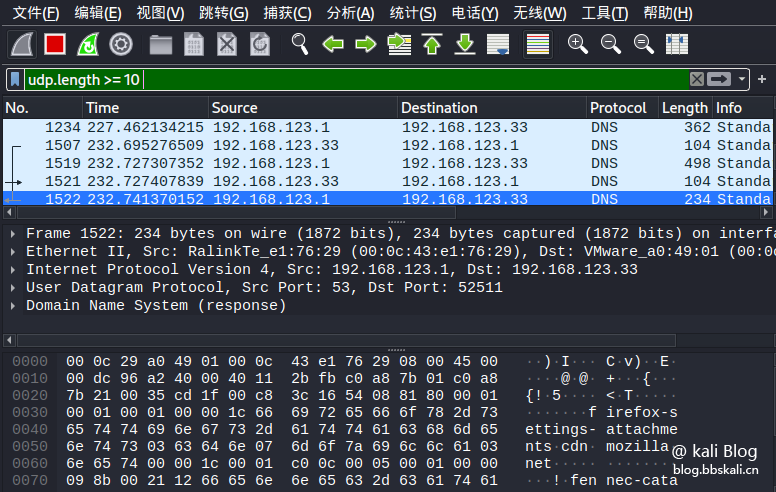
Only display packets with lengths of tcp protocol greater than or equal to 1000
tcp.len=1000 only display packets with lengths of tcp protocol clusters greater than or equal to 100 and are packets of HTTP protocol
tcp.len=100 http
Filter packet length
Only display packets of HTTP protocol
http
Only data packets that display data requested by GET
http.request.method=='GET' only displays data packets for gost requested data
http.request.method=='GOST' only displays the packets of http and contains the packets of string 404
http contains 404
Filter HTTP
Capacity improvement
Right-click to select the tracking stream in a certain http data packet or tcp data packet. You can aggregate or restore the HTTP stream or TCP stream into data, and you can see the data content in the pop-up box.
The options here also vary depending on the packet type. Because I chose the TCP protocol here. Therefore, when right-clicking to track the flow, you can only choose TCP flow 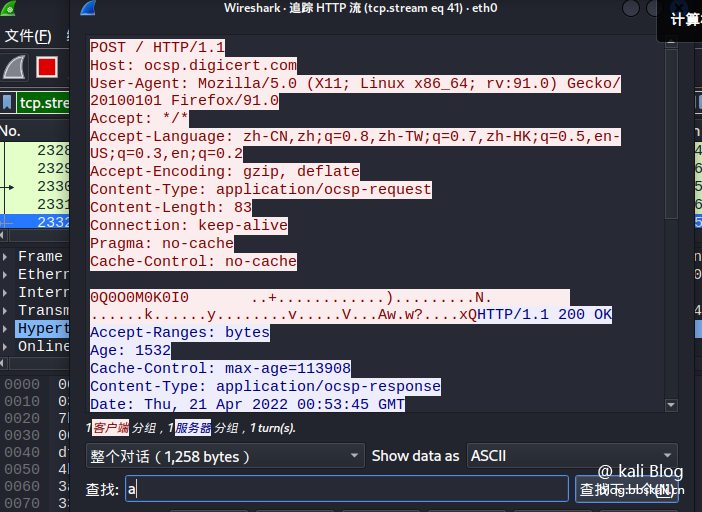
Data flow tracking
Export all data files of a protocol
Click the file in the menu bar, select the export object, and then select the protocol we want to export. I choose HTTP 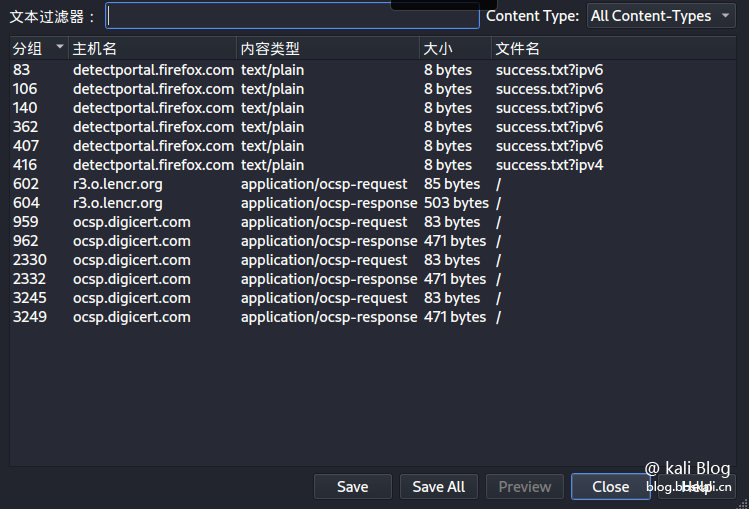 here
here
After selecting the save path. You can check which files and pictures it requested 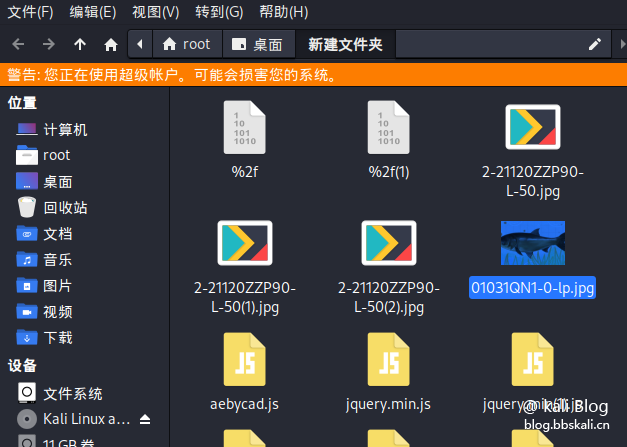
Extraction of data packets
Select the packet we want to save. Then find Portable Network Graphics in the column after the packet has been formatted. If you take the first letter, it is PNG.
Other file types are similar here. They all take the first letter. After right click. Click to display grouped bytes.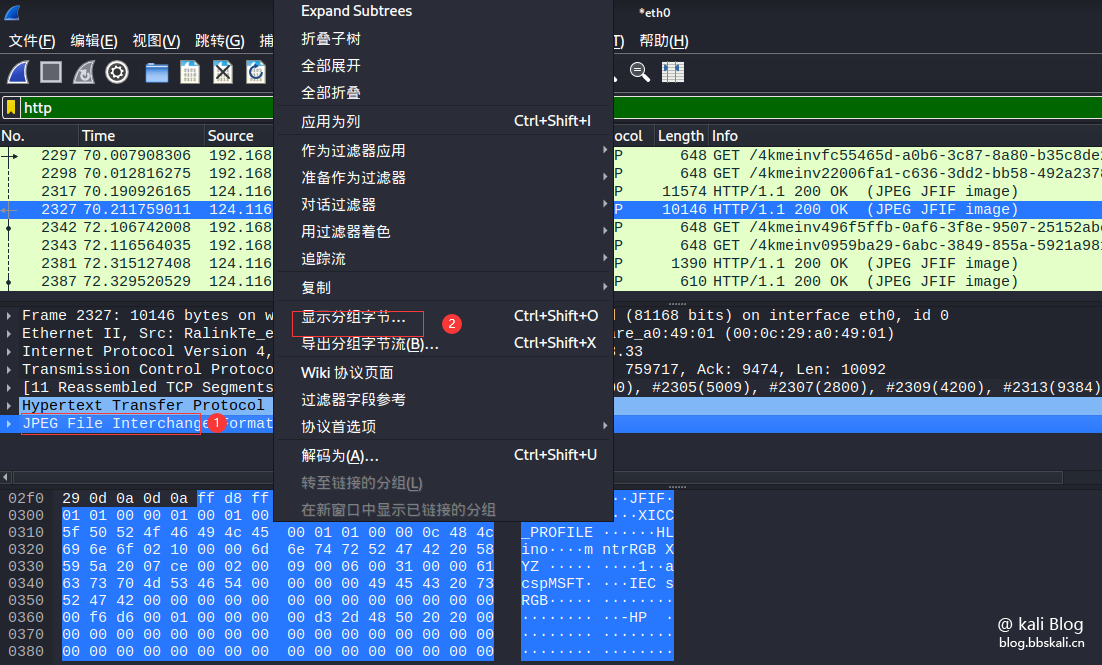
The effect is as follows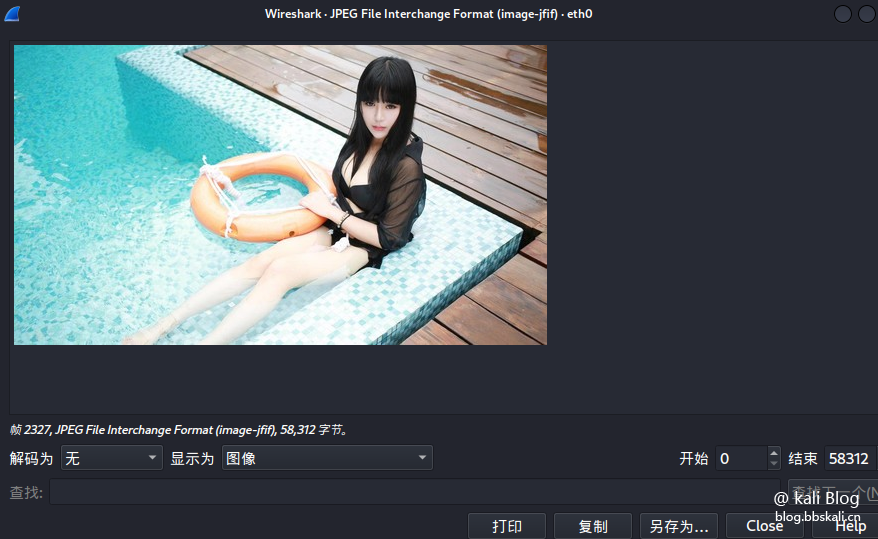
Export a packet file
http.request.method=='GOST' 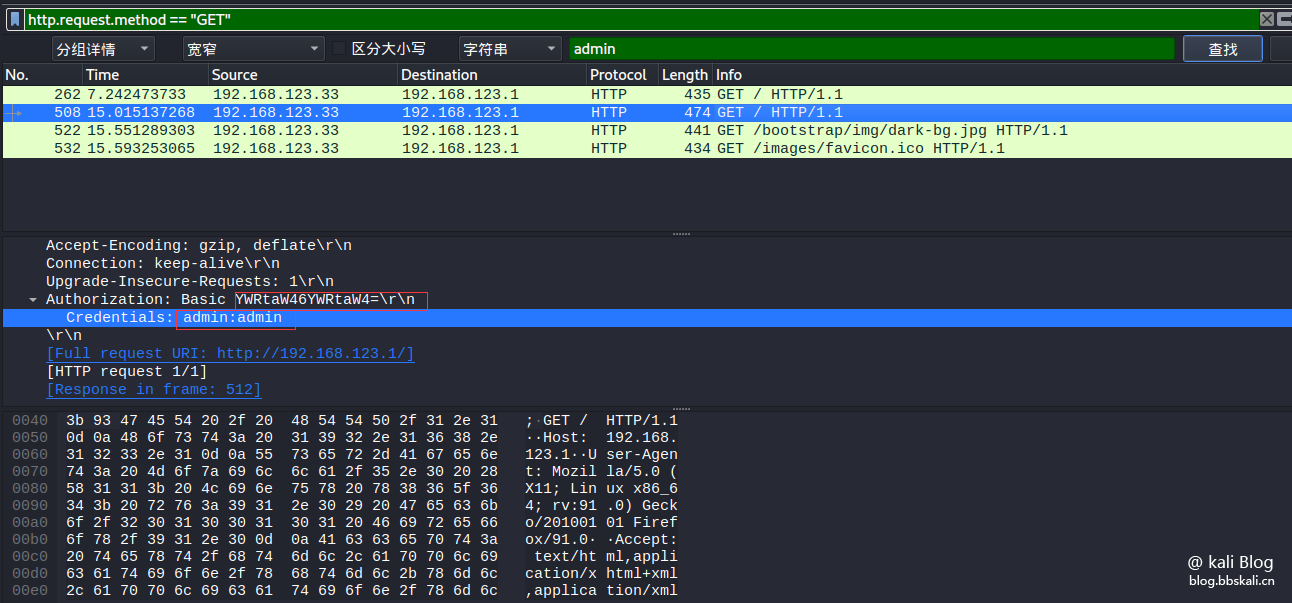
Crawl password (only http websites are valid)
Press ctrl+f to search hexadecimal 00 00 00 0d 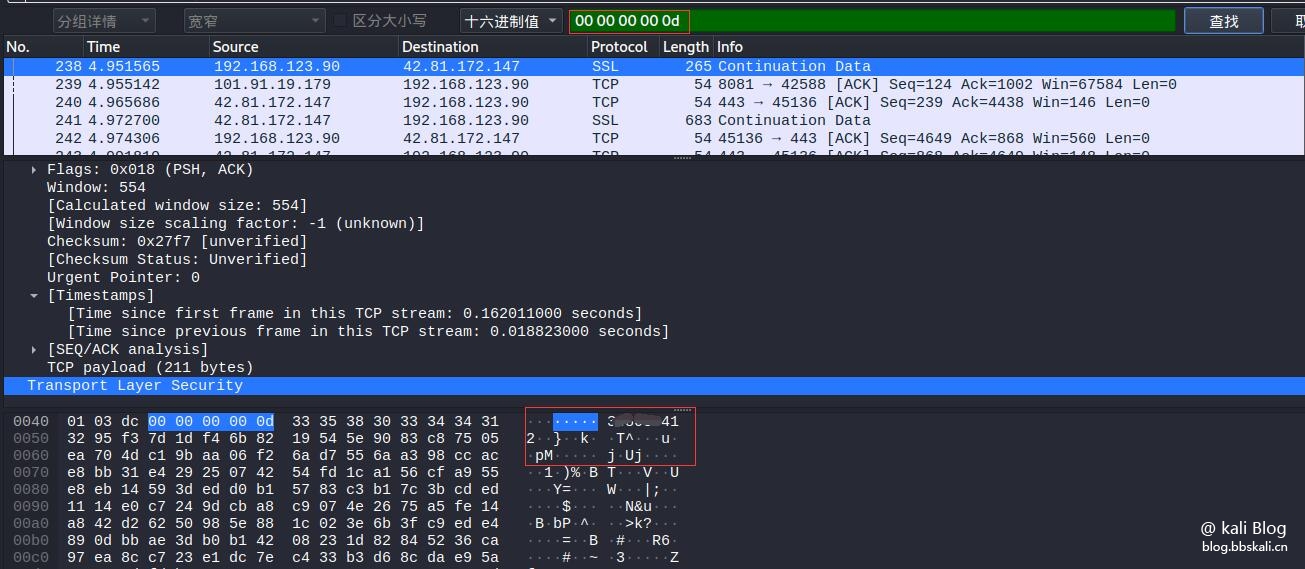
Recommended Comments